Q2 2025 Investment Commentary
Our seven year milestone and a review of Atlas Engineered Products (AEP)

Introduction
Strategy Milestone: Seven Years of Progress
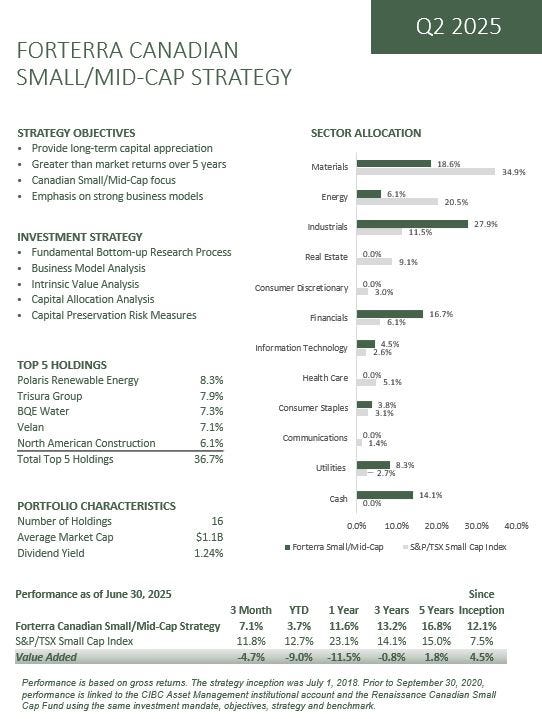
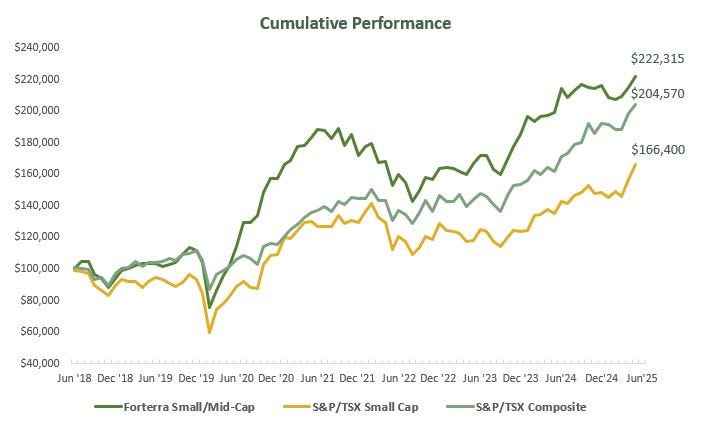
June 30th marks the anniversary of our flagship Forterra Small/Mid-Cap strategy. As we do each year, we take this opportunity to reflect on our performance. Since inception seven years ago, the strategy has outperformed our primary benchmark, the S&P/TSX Small Cap Index, by an annualized 4.5%.
To put this in perspective, a $100,000 investment in the strategy would have grown to $222,315, versus $166,400 for the benchmark. Additionally, we outperformed the broader S&P/TSX Composite Index over the same period.
We aim to deliver returns above the benchmark, but more importantly, we strive to double the value of the portfolio every 5-7 years. By both measures, we have succeeded. That said, we recognize that market conditions change, and periods of underperformance are inevitable. We celebrate our progress, but we remain focused on the work ahead, never resting on our laurels.
It's All Relative. Or Is It?
Measuring performance relative to a benchmark can be useful for a few reasons.
First, it helps explain short-term results, which is why we reference the S&P/TSX Small Cap Index – it is composed of smaller Canadian companies that are within our investment opportunity set.
Second, benchmarks are also helpful over the long term when comparing active strategies to passive ones, which is why we include the more popular S&P/TSX Composite Index as a secondary reference.
But we believe benchmarks tell only part of the story.
Our strategy is structurally different. It doesn’t resemble the benchmark and isn’t intended to. That’s why we consider a five-year horizon to be the starting point for meaningful comparison. Over shorter periods, our performance may diverge sharply from what is working in the market.
· The S&P/TSX Small Cap Index includes 241 companies. We own 16.
· Half of the portfolio holdings are not in the index at all.
· The portfolio’s active share exceeds 95%, with less than 5% overlap.
Being different is a prerequisite for outperformance. We don’t spend time analyzing index components. Instead, we focus our energy on identifying long-term wealth-creating companies.
More importantly, we believe in absolute returns. You can’t spend relative returns in retirement. That’s why our primary goal remains: double capital every 5-7 years, equivalent to a 10-15% compound annual return. Achieving this is easier in bull markets and harder in downturns.
A focus on absolute returns means avoiding the risk of permanent capital loss. This can be challenging in small-cap investing, where things can change quickly, volatility is amplified, and even high-quality businesses may suffer in risk-off environments. It’s also harder when broad markets are near record highs (see Market Commentary), increasing the chance of pullbacks.
Over the past year, we underperformed our benchmark. This was due to our more conservative valuation discipline, which led to holding a higher cash buffer in the portfolio — a decision that weighed on short-term results. Additionally, the benchmark’s 10% higher exposure to precious metals significantly impacted relative performance.
We’ve seen periods of relative underperformance before, and we will again. It’s part of the investment process. We continue to aim for long-term outperformance, but never at the expense of capital preservation or our goal of achieving long-term capital growth.
Market Commentary – All-Time Highs
The market closed the second quarter of 2025 with a growing list of indices and indicators hitting—or hovering near—all-time highs. As market cycle expert Howard Marks often reminds us, understanding where we are in the cycle can be more useful than trying to predict what comes next. We pay close attention to market signals—not to forecast, but to understand the environment in which we’re investing. These signals help us assess when the market is driven by fear and when it's driven by greed.
Let’s take a closer look at what the market is telling us:
S&P 500 and S&P/TSX Composite – At All-Time Highs
The rebound from April’s lows through June marked the second-fastest recovery in 75 years for the S&P 500. In less than three months, the index climbed from bear market territory to a record high. The return of optimism wasn’t gradual—it surged back. Canada’s S&P/TSX Composite followed a similar pattern, also reaching new highs.
NASDAQ – At All-Time High
With technology companies leading the rally, the NASDAQ is also at an all-time high. Optimism surrounding the AI revolution and continued strength in mega-cap tech remains a dominant theme.
Bitcoin – At All-Time High
Bitcoin continues to confound traditional analysis. On the surface, the message is clear: investors expect the price to rise. But it may also reflect a hedge against U.S. dollar weakness, an inflationary buffer, or a speculative bet on a favorable regulatory environment—particularly under a potentially crypto-friendly Trump administration. Speculative crypto tokens have also surged, further reflecting risk-seeking behavior.
Gold – Near All-Time High
Gold’s message is similarly complex. On one hand, its rise can be viewed as a hedge against inflation and currency risk. On the other, it’s attracting momentum-driven buying. Notably, central banks are accumulating gold at the highest rate in decades—suggesting deepening concern about fiat currency stability.
Copper – Near All-Time High
Often called “Dr. Copper” for its predictive power on economic health, copper is sending mixed signals. Prices remain high—driven less by current economic strength and more by long-term structural demand. The global shift to electrification (EVs, data centers, grid upgrades) is expected to drive copper demand, even as current macro indicators flash mixed signals.
U.S. National Debt – All-Time High
With the passage of the “One Big Beautiful Bill”, U.S. debt levels are climbing further into uncharted territory. While the U.S. dollar’s status as the world’s reserve currency has allowed greater fiscal flexibility, the rising gold price may suggest that the world is beginning to hedge against the limits of U.S. exceptionalism. In May, Moody’s became the final major rating agency to downgrade U.S. government debt from AAA status.
Warren Buffet’s Cash Pile – All-Time High
Berkshire Hathaway’s growing cash position can be read as a signal of caution. With so much cash on hand and so few investments being made, the implication is that compelling opportunities are scarce at current valuations. In fact, at a Berkshire Hathaway meeting in 1995, Buffett clearly said, “…and when you see cash on our balance sheet of any size, that’s an acknowledgement by Charlie and me that we have not found anything, in size anyway, attractive at that point. It’s never a policy of ours to hold a lot of cash.”
Where Are the Lows?
Amid all the highs, a few metrics are testing historic lows—telling their own part of the story.
S&P 500 Dividend Yield – 25-Year Low
Yields have not been this low since the height of the dot-com bubble. This suggests that valuations are stretched, and that investors are accepting less compensation for equity risk.
U.S. Investment Grade Credit Spreads – 20-Year Low
Investment-grade bond spreads are at their tightest levels since 2005. Investors are accepting minimal premium for credit risk—signalling a stretch for yield and complacency in fixed income markets as well.
Signals in the Noise
Collectively, the data suggests that asset prices are elevated, with few signs of investor caution. Our own research echoes this—momentum is dominating sentiment, and many companies on our watchlist have pushed beyond fair value.
That said, all-time highs tend to lead to more all-time highs, statistically speaking. Bull markets often continue far longer than expected—sometimes for years. That’s why we don’t try to time markets. Instead, we stay vigilant.
For us, this environment is a clear signal to remain disciplined on valuation and to be wary of crowded trades. Enthusiasm and optimism are powerful forces, but they’re also signs to stay grounded. We continue our research with patience, knowing that better buying opportunities often emerge when fear returns.
Even in this market, we can find underappreciated companies, though they are just a little harder to come by. Our watchlist list remains ready, waiting for the next pocket of pessimism to create better opportunities.
Portfolio Review
During the second quarter of 2025, the Forterra Canadian Small/Mid-Cap portfolio returned 7.1% gross of fees, underperforming the S&P/TSX Small Cap Index, which gained 11.8%. The S&P/TSX Composite Index rose 8.5%, broadly in line with gains across many large-cap global markets. Meanwhile, the technology-heavy Nasdaq rebounded sharply, rising 17.7% as investors largely “bought the dip” following market weakness in the first quarter.
Ongoing market volatility during the quarter created opportunities to trim or add to existing positions. We also exited two holdings over the period—with one outcome proving more successful than the other.
We exited our long-held position in EQB Inc., as we viewed the risk/reward to be more balanced going forward. The recent departure of CFO Chadwick Westlake was a concern, highlighting succession risk around long-serving President and CEO Andrew Moor. Additionally, we anticipated a more challenging operating environment for EQB over the next few years, as a wave of mortgage renewals is expected to place pressure on both consumers and housing prices.
EQB was a highly successful long-term investment for us. After monitoring the company for several years, we initiated a position during the COVID-19 market selloff in March 2020. Although we exited that initial investment shortly thereafter at a profit, we re-established a position in September 2020 at a modestly higher price, having reassessed the long-term opportunity. We held the stock until April 2025, generating a cumulative total return of 155% over four and a half years—equivalent to a compound annual growth rate of approximately 23%.
Tragically, Mr. Moor passed away suddenly in late June, leaving a significant leadership gap at the bank. The board acted swiftly, appointing Chadwick Westlake—who had recently taken on the role of CFO at OpenText—as President and CEO of EQB, effective August 25, 2025. We had the pleasure of meeting Mr. Moor on several occasions over the past five years, and his energy, vision, and leadership will be deeply missed. His commitment to building a challenger bank in Canada is a lasting legacy.
We believe EQB will be in capable hands under Mr. Westlake’s leadership. While we do not see the risk/reward as compelling at this time, we will continue to monitor the company for potential re-entry opportunities.
We exited our position in Data Communications Management (DCM) in early June after our original investment thesis broke down. We had expected the merger with specialty print competitor MCC to drive modest growth, pricing power, and cost synergies through plant consolidation and workforce reductions. We also believed free cash flow would improve, allowing the company to deleverage. Additionally, we saw upside potential in DCM’s emerging digital services business.
However, several challenges emerged. The MCC acquisition included $20–30 million in low-margin revenue, which was later shed to protect margins—undermining the original synergy targets and making the acquisition price appear less attractive in hindsight. Integration took priority over growth, with plant closures, workforce reductions, and salesforce restructuring proving more disruptive than anticipated. Despite the repeated plan for ~5% growth, there has been no organic growth over the past two years.
DCM’s performance was also hurt by labour disruptions at Canada Post, a major client and an important shipping partner. A postal strike in late 2024, followed by a steep rate hike in early 2025 and the threat of another strike in April 2025, led to delays and cancellations in customer projects. We see three long-term risks stemming from this:
· Accelerated declines in bill/statement printing, as utilities, telecoms, and banks aggressively push digital adoption.
· Reduced marketing mail volumes due to significantly higher postage costs.
· Structural changes to Canada Post’s delivery model, potentially ending daily home delivery in favour of more profitable parcel services.
While we initially expected a short-term disruption, the instability at Canada Post now appears to be a potential long-term headwind for DCM’s core business.
On other fronts, the digital services segment has yet to make a meaningful contribution, and we don’t see this changing materially in the next 2–3 years. Capital allocation decisions were also disappointing. Instead of paying down debt or repurchasing shares, DCM issued a special dividend. While this benefited shareholders in the short term, we believe it came at the cost of long-term value creation.
To be clear, the story is not broken— it’s just no longer compelling. Management deserves credit for a complex integration and for improving margins. But organic growth and capital allocation have fallen short, and these are critical for future returns.
As part of our investment process, we reflect deeply on missteps. This case reinforced several lessons: investing in structurally declining industries is hard and it comes with more inherent downside risk; synergy targets are often aspirational; and when a key partner like Canada Post comes under pressure, exposure is difficult to mitigate.
Our total return on DCM, including dividends, was -33%. While losses are an inevitable part of long-term investing, it is a humbling experience. Our focus is on learning from mistakes and minimizing their impact. By analyzing where our thesis failed, we aim to sharpen our decision-making and improve outcomes over time.
We opportunistically added to Champion Iron in April as lower iron ore prices and trade tensions sent the shares to a three-year low. In the same month, we also added to BQE Water, Atlas Engineered Products, Andean Precious Metals and Polaris Renewable Energy.
In May and June we incrementally added to Foraco International and Colabor Group as shares came under pressure. We trimmed our positions in K92 Mining and Andean Precious Metals as these shares ran hard on the back of higher prices for gold and silver.
Performance Review
The largest contributor to performance over the quarter was Andean Precious Metals, which soared 78% during the period and was up 113% from when we added to the position in April. The company benefits from exposure to both silver and gold, both of which posted gains in the second quarter. Similarly, K92 Mining, a junior gold producer, rose 24% over the period.
Specialty insurer, Trisura Group rebounded in the quarter, up 33% on strong earnings and an improving outlook. Mattr also recovered from recent lows, gaining 17% as concerns about tariffs eased and investors refocused on the company’s longer-term value potential.
Champion Iron was a notable detractor, falling 16% as iron ore prices declined 8% during the quarter. Markets anticipated weaker demand for iron ore out of China, pushing short-term investors to the sidelines. We take a longer-term view and expect that Champion’s higher-purity iron ore will command a premium that will be more resilient than the standard index price.
Industrial valve manufacturer Velan also detracted from performance, as it drifted 9% lower over the quarter despite posting strong year-end results in May. We suspect part of the weakness was due to long-term shareholders taking profits as shares reached near five-year highs after an erratic run over the past three years. We continue to see significant upside for Velan, as global investment in nuclear energy and LNG infrastructure supports what we believe will be a new cycle of growth for the company.
Feature – Atlas Engineered Products
Long-Term Thinking in a Cyclical Industry
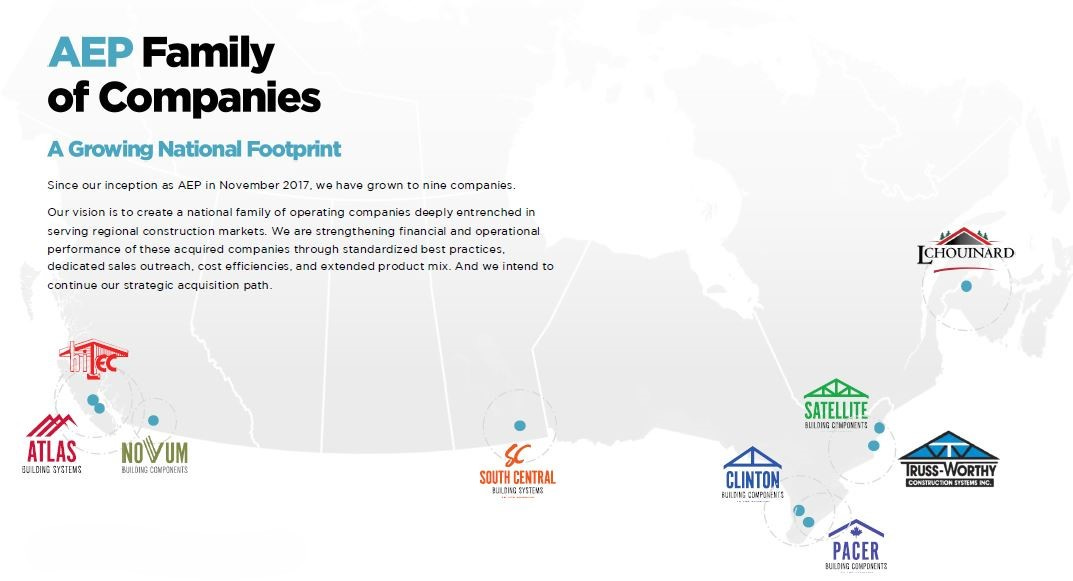
Atlas is a market leader in Canada for manufactured and engineered structural wood components, serving residential and commercial builders. Its products—trusses, wall panels and engineered wood products—are used in single-family homes, townhouses, low-rise multi-family buildings, and agricultural structures. Over time, Atlas has built a network of ten businesses across Canada, consolidating a fragmented industry to unlock meaningful scale advantages.
We began researching Atlas over three years ago. Since then, we've visited the company’s head office and toured several of its facilities, including the Atlas Building Systems plant in Nanaimo, BC, and the Pacer and Clinton plants near London, Ontario. It took time to fully understand the cyclical nature and regional variations of the business. Roughly a year ago, we initiated a small position in our portfolio, which we’ve since added to incrementally during the second quarter.
While this investment may require patience, it reflects our long-term approach to investing in cyclical businesses. It also underscores our willingness to think independently and to do the work well in advance of making an investment.
A Brief History
Atlas was founded in 1999 and is headquartered in Nanaimo, British Columbia, where it became a dominant player on Vancouver Island. It went public on the TSX Venture Exchange in 2017 with the goal of consolidating the fragmented truss manufacturing industry under the leadership of founder Hadi Abassi. Since then, the company has made a series of acquisitions:
· Clinton Roof Truss (Clinton, ON) – February 2018
· Satellite Building Components (Merrickville, ON) – August 2018
· Pacer Building Components (Ilderton, ON) – November 2018
· South Central Building Systems (Carman, MB) – March 2019
· Novum Building Components (Abbotsford, BC) – July 2020
· Hi-Tec Industries (Lantzville, BC) – February 2022
· Leon Chouinard & Fils (Eel River Crossing, NB) – August 2023
· Truss-Worthy Construction Systems (Colborne, ON) – June 2025
· Penn-Truss MFG (Saltcoats, SK) – July 2025
What They Do
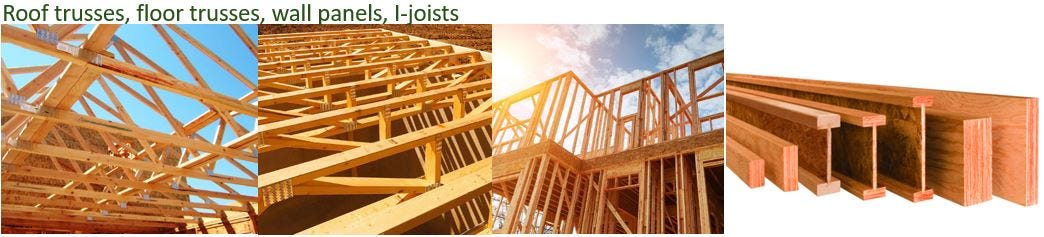
Roof & Floor Trusses - (63% of Revenue in 2024)
Atlas designs and builds roof and floor trusses—precision-engineered components tailored to meet strength and code requirements. These are not off-the-shelf products; they are custom-built for each project. Atlas has the capacity to handle complex designs and deliver them efficiently for on-site assembly.
Prefabricated roof trusses began to gain traction in the 1950s, and by the 1980s, they became standard in most residential construction due to their consistency, strength-to-weight efficiency, and labour-saving advantages. On-site, hand-framed trusses are now increasingly rare.
Wall Panels - (10% of Revenue in 2024)
Atlas also manufactures prefabricated wall panels—pre-assembled stud-and-sheathing units designed for quick and precise installation. These panels can reduce framing costs by up to 25% and cut build times by as much as 35%.
Wall panels were once a niche offering, but adoption has accelerated over the past decade, driven by labour shortages and the demand for faster, more efficient construction. This is a growing segment for Atlas: wall panels have gone from 0% of revenue in 2022 to 10% in 2024, showing steady adoption across its customer base.
Engineered Wood Products - (27% of Revenue in 2024)
While Atlas does not manufacture engineered wood products itself, it distributes a wide selection of structural components, such as glulam beams, LVL (laminated veneer lumber), and I-joists. These products are often integrated into truss and panel designs and are shipped together for ease of installation.
Atlas’s scale allows it to secure preferential pricing and terms from suppliers, which enhances margins and improves working capital efficiency.
Management Team
Founder, President, and CEO Hadi Abassi is a straight-talking entrepreneur with over 25 years of experience in building materials and construction. He is supported by CFO Melissa MacRae, COO Gurmit Dhaliwal, and a team of regional managers and sales leaders. The board includes Don Hubbard (Chairman), who brings over 40 years of industry experience, and Paul Andreola, who advises on capital markets and capital allocation.
Our Thoughts on the Cycle
Successfully investing in Atlas will depend, in part, on the Canadian housing cycle. That said, our investment thesis is not based on trying to time a recovery. Rather than predicting when or how the cycle will turn, we’re focused on whether Atlas can strengthen its competitive position throughout the downturn. Judging by where the shares are trading, most investors appear to be taking a different approach. In our view, if you're waiting for irrefutable evidence that the housing market is recovering, you may already be too late.
Private equity interest in the Canadian truss market peaked post-COVID, but we are now starting to see reduced M&A activity and fewer new entrants. Many smaller players are beginning to struggle and may look to exit. Atlas, meanwhile, has continued to acquire and invest, taking a counter-cyclical approach that we believe will enhance its long-term competitiveness.
The Investment Case
An Industry Ripe for Consolidation and Automation
With over 200 smaller companies, the Canadian truss industry is highly fragmented, and market dynamics are region-specific. Most competitors are small, privately owned businesses that generate $3 to $15 million in revenue and face succession issues.
Historically, truss plants have been labour-intensive. As labour costs rise and skilled labour becomes harder to find, companies are under increasing pressure to automate parts of the manufacturing process. While most Canadian plants have adopted basic automation—such as saws and stackers—larger players like Atlas have gone further, incorporating laser-guided positioning systems, movable guided pins, and roller tables.
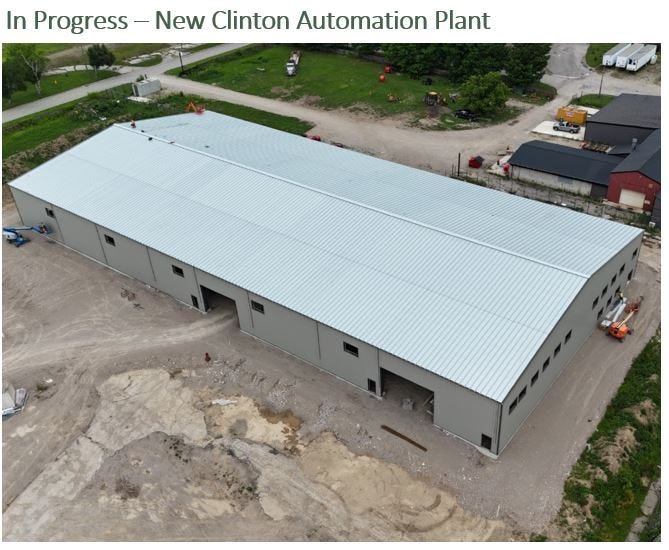
Atlas is now taking a significant leap forward by introducing advanced robotic manufacturing at its new facility in Clinton. As barriers to entry in this market continue to rise, Atlas is raising the stakes. Most competitors are not in a position to respond, and we expect that some will exit the market as a result.
Over the long term, we expect the industry to consolidate around a few large regional players. As this happens, scale advantages should widen, smaller firms will struggle to compete, and pricing power will tilt toward firms like Atlas.
Atlas is the only public company consolidating in this Canadian market niche, and we believe that it is uniquely positioned to grow through strategic acquisitions, by taking market share and gaining wallet share.
Scale Advantages Are Taking Hold
We believe that Atlas is benefiting from powerful scale advantages in buying power and efficiency and soon it will be an industry leader in automation. We see a path for these advantages to grow stronger as Atlas continues to scale.
Buying Power
Atlas negotiates superior supplier terms and benefits from vendor-managed inventory (VMI) programs that reduce risk, lower working capital needs, and improve availability. Atlas also benefits from being able to carry a wide variety of engineered wood products at very good rates.
Efficiency and Network Scale
Its proprietary ERP system improves project tracking and staffing efficiency. Plants can collaborate on orders, share design talent, and replicate best practices across the network. Only large-scale players can invest in the systems to track KPIs and closely manage their margins.
Invest in Automation
A new greenfield plant in Clinton will house a state-of-the-art automated truss line. Once completed in mid-2026, this plant is expected to double truss output with half the labour. Management expects a payback period of under two years. This automated line will give Atlas a cost advantage that it can choose to pass on to customers (*scale economies shared) to take market share while still enjoying attractive margins.
*Scale economies shared is a concept coined by Nick Sleep and Qais Zakaria, referring to a business model where companies achieve cost advantages through scale and deliberately pass those savings on to customers (e.g., via lower prices or better value), creating a virtuous cycle of customer loyalty, increased volume, and compounded growth. Costco and Amazon are common examples.
Share of Wallet Growth
There is significant room for organic growth through greater adoption of wall panels and engineered wood products. We believe that this “wallet-share” growth is not cycle-dependent and can create more resiliency in the business. Atlas has recently expanded its sales team to better pursue these cross-selling and expansion opportunities.
Optionality
We prefer investment cases with multiple ways to win. Atlas offers several:
· Strategic M&A: Atlas could use acquisitions to expand into regions where it has less exposure (e.g. Alberta). We do not assume any further acquisitions in our base case, but well executed accretive acquisitions could fuel growth.
· U.S. Expansion: Atlas already has limited sales into Michigan (under CUSMA), but there is an opportunity to expand further into other states (Maine, Vermont, North Dakota, Washington).
· Wall Panel Tailwinds: If demand for wall panels accelerates—particularly in response to labour shortages—Atlas is well-positioned to scale up supply quickly.
· Automation Success: If the Clinton plant exceeds expectations, it could become a blueprint for additional automation across Atlas’s network.
· Housing Cycle Inflection: While not our base case, a recovery in Canadian housing would unlock greater sales, provide margin upside and drive higher plant utilization.
· Takeout Potential: Large U.S. players are consolidating. Atlas could become an attractive acquisition target, but we believe management has a long-term vision to build a much larger company.
Risks
Competitive Response to Automation
If competitors respond by matching Atlas’s automation investments in an effort to lower their unit costs and stay afloat, it could have negative consequences. Returns on invested capital would decline, and the payback period for Atlas’s automation projects would be extended.
Prolonged Downturn
A slow or stalled housing recovery could weigh on results for years. Affordability remains a key challenge, driven by high land, materials, labour, and development costs. While governments are trying to address these issues by reducing red tape and increasing incentives, these efforts may not be successful.
Execution Risk in Automation
All new projects come with challenges, and Atlas has experienced this firsthand. An earlier partnership with automation specialist House of Design was intended to retrofit automation into two existing facilities. However, House of Design encountered its own difficulties and was ultimately forced to dissolve.
This time, Atlas has partnered with Trussmatic, a Finnish company whose technology has been successfully deployed in over 20 automated lines globally. Trussmatic is considered an industry leader. That said, even with a strong partner, project delays and slower ramp-up periods remain risks.
Capital Allocation Missteps
Atlas could make a poor acquisition or deploy capital too quickly and find itself over-leveraged with debt. It could also dilute shareholders by raising capital in an untimely manner. We believe that Atlas’s management and board have been judicious with capital to date, but we intend to monitor this closely.
Key Person Risk
Founder Hadi Abassi owns over 10% of the company and plays a central leadership role. There is no obvious successor in place. Like most small founder-led companies, this risk is difficult to avoid. We believe the board would work to replace him, but the task would not be easy.
Valuation
We evaluate Atlas’s valuation in several ways.
DCF Analysis: Using conservative growth, capex, and cash flow assumptions, our discounted cash flow analysis yields a long-term value of ~$2.20/share. This approach is helpful for understanding the business model but is sensitive to macro assumptions.
Relative Valuation: Shares currently trade at ~5x 2026E EV/EBITDA, compared to 7–8x for larger peers. Applying a multiple of 7.5x to 2026 and 6.5x to 2027 estimates implies a valuation range of $1.40–$1.60/share.
We believe the downside is limited. Even in a stressed scenario—e.g., cost overruns and delays pushing EBITDA lower in 2026 —shares might trade at ~$0.60–$0.65, or ~4x reduced 2027 estimates. With shares currently trading between $0.80–$0.90, the risk/reward profile remains attractive.
Final Thoughts
Given the long-term asymmetry we like the prospects, despite the uncertainty around the cycle. In some ways, we are also thinking counter-cyclically. In a market near all-time highs, Atlas is quietly getting stronger –but is trading closer to its 52-week lows.
Atlas is one of the smaller positions in the portfolio because of its cyclical exposure and its microcap status. However, it represents the type of business we want to own: one that improves its position through the cycle and acts with discipline and foresight.
Atlas is building through the downturn, and we’re happy to build our position alongside it.
Strategy Factsheet